


| 30 Mar 2010 | JobID: TLSMD7780_IMKsrOzP | TLSMD Version 1.4.1 |
| Analysis of TLS Group 20 Chain Segments (overall rmsd_b=20.60 and residual=30.63) | |||||||||||
|---|---|---|---|---|---|---|---|---|---|---|---|
| Input Structure | TLS Predictions | ||||||||||
| Color | Segment | Residues | Atoms | <B> | Brmsd | <Aniso> | RMSD B | Tr B | eval(L) DEG2 | <B> | <Aniso> |
| 1-17 | 20 | 153 | 31.2 | 31.84 | 1.00 | 18.49 | 11.5 | 0.00, 9.07, 18.59 | 31.2 | 0.39 |
| 18-42 | 25 | 191 | 25.3 | 25.12 | 1.00 | 19.35 | 6.1 | 33.34, 0.00, 14.18 | 25.3 | 0.48 |
| 43-91 | 49 | 353 | 23.7 | 20.73 | 1.00 | 18.93 | 5.8 | 13.60, 6.04, 1.71 | 23.7 | 0.66 |
| 92-104 | 13 | 109 | 35.8 | 31.60 | 1.00 | 20.52 | 6.5 | 0.00, 43.30, 32.12 | 35.8 | 0.40 |
| 105-121 | 17 | 124 | 32.7 | 26.86 | 1.00 | 22.14 | 19.8 | 73.20, 0.00, 0.00 | 32.7 | 0.62 |
| 122-130 | 9 | 60 | 32.3 | 24.89 | 1.00 | 15.91 | 11.1 | 104.87, 0.00, 33.40 | 32.3 | 0.49 |
| 131-150 | 20 | 142 | 52.0 | 33.82 | 1.00 | 24.14 | -2.5 | 66.79, 27.05, 0.00 | 52.0 | 0.58 |
| 151-174 | 24 | 168 | 52.6 | 30.67 | 1.00 | 24.02 | 27.4 | 46.07, 0.00, 19.65 | 52.6 | 0.65 |
| 175-193 | 19 | 139 | 58.5 | 31.59 | 1.00 | 26.82 | 37.0 | 136.32, 6.32, 0.00 | 58.5 | 0.75 |
| 194-208 | 15 | 130 | 42.7 | 28.09 | 1.00 | 22.55 | 11.9 | 32.36, 4.51, 0.00 | 42.7 | 0.64 |
| 209-247 | 39 | 301 | 31.1 | 25.98 | 1.00 | 18.54 | 10.8 | 35.45, 0.00, 4.49 | 31.1 | 0.50 |
| 248-259 | 12 | 105 | 42.9 | 32.54 | 1.00 | 23.47 | 18.6 | 112.45, 31.90, 0.00 | 42.9 | 0.55 |
| 260-286 | 27 | 215 | 29.9 | 23.11 | 1.00 | 18.43 | 12.2 | 35.46, 7.89, 0.00 | 29.9 | 0.57 |
| 287-313 | 27 | 217 | 21.6 | 20.48 | 1.00 | 18.59 | 9.8 | 0.00, 8.77, 13.23 | 21.6 | 0.65 |
| 314-326 | 13 | 98 | 36.4 | 30.22 | 1.00 | 19.41 | 8.2 | 145.35, 9.91, 0.00 | 36.4 | 0.49 |
| 327-331 | 5 | 44 | 48.3 | 35.15 | 1.00 | 25.55 | 23.6 | 0.00, 288.98, 0.00 | 48.3 | 0.52 |
| 332-402 | 71 | 557 | 28.6 | 24.32 | 1.00 | 21.41 | 13.9 | 14.44, 4.66, 0.00 | 28.6 | 0.65 |
| 403-430 | 28 | 227 | 31.0 | 27.41 | 1.00 | 23.36 | 17.2 | 28.19, 5.79, 0.00 | 31.0 | 0.59 |
| 431-436 | 6 | 42 | 53.5 | 31.44 | 1.00 | 23.96 | 43.7 | 0.00, 138.72, 0.00 | 53.5 | 0.65 |
| 437-447 | 11 | 94 | 53.9 | 35.13 | 1.00 | 25.33 | -8.9 | 45.46, 14.68, 0.00 | 53.9 | 0.55 |
| Mean BFactor Analysis |
|---|
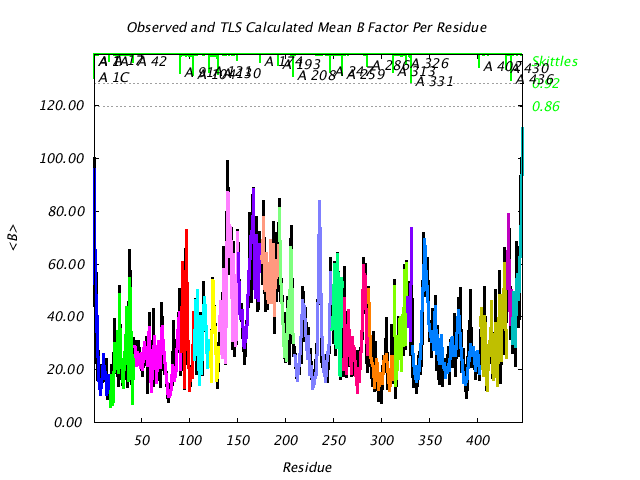 |
Comparison of TLS predicted B factors with experimental (input) B factors. |
| RMSD B Values of Combined TLS Groups | |||||||||||||||||||||||||||||||||||||||||||||||||||||||||||||||||||||||||||||||||||||||||||||||||||||||||||||||||||||||||||||||||||||||||||||||||||||||||||||||||||||||||||||||||||||||||||||||||||||||||||||||||||||||||||||||||||||||||||||||||||||||||||||||||||||||||||||||||||||||||||||||||||||||||||||||||||||||||||||||||||||||||||||||||||||||||||||||||||||||||||||||||||||||||||||||||||||||||||||||||||||||||||||||||||||||||||||||||||||||||
|---|---|---|---|---|---|---|---|---|---|---|---|---|---|---|---|---|---|---|---|---|---|---|---|---|---|---|---|---|---|---|---|---|---|---|---|---|---|---|---|---|---|---|---|---|---|---|---|---|---|---|---|---|---|---|---|---|---|---|---|---|---|---|---|---|---|---|---|---|---|---|---|---|---|---|---|---|---|---|---|---|---|---|---|---|---|---|---|---|---|---|---|---|---|---|---|---|---|---|---|---|---|---|---|---|---|---|---|---|---|---|---|---|---|---|---|---|---|---|---|---|---|---|---|---|---|---|---|---|---|---|---|---|---|---|---|---|---|---|---|---|---|---|---|---|---|---|---|---|---|---|---|---|---|---|---|---|---|---|---|---|---|---|---|---|---|---|---|---|---|---|---|---|---|---|---|---|---|---|---|---|---|---|---|---|---|---|---|---|---|---|---|---|---|---|---|---|---|---|---|---|---|---|---|---|---|---|---|---|---|---|---|---|---|---|---|---|---|---|---|---|---|---|---|---|---|---|---|---|---|---|---|---|---|---|---|---|---|---|---|---|---|---|---|---|---|---|---|---|---|---|---|---|---|---|---|---|---|---|---|---|---|---|---|---|---|---|---|---|---|---|---|---|---|---|---|---|---|---|---|---|---|---|---|---|---|---|---|---|---|---|---|---|---|---|---|---|---|---|---|---|---|---|---|---|---|---|---|---|---|---|---|---|---|---|---|---|---|---|---|---|---|---|---|---|---|---|---|---|---|---|---|---|---|---|---|---|---|---|---|---|---|---|---|---|---|---|---|---|---|---|---|---|---|---|---|---|---|---|---|---|---|---|---|---|---|---|---|---|---|---|---|---|---|---|---|---|---|---|---|---|---|---|---|---|---|---|---|---|---|---|---|---|---|---|---|---|---|---|---|---|---|---|---|---|---|---|---|---|---|---|---|---|---|---|---|---|---|---|---|---|---|---|---|---|---|---|---|---|---|---|---|---|---|---|---|---|---|---|---|---|---|
| |||||||||||||||||||||||||||||||||||||||||||||||||||||||||||||||||||||||||||||||||||||||||||||||||||||||||||||||||||||||||||||||||||||||||||||||||||||||||||||||||||||||||||||||||||||||||||||||||||||||||||||||||||||||||||||||||||||||||||||||||||||||||||||||||||||||||||||||||||||||||||||||||||||||||||||||||||||||||||||||||||||||||||||||||||||||||||||||||||||||||||||||||||||||||||||||||||||||||||||||||||||||||||||||||||||||||||||||||||||||||
The TLSMD optimization algorithm models TLS groups as sequential segments of a protein or DNA/RNA chain. This matrix shows the RMSD B values of the individual groups on the diagonal, and the RMSD B values of combined groups as off-diagonal elements. This helps identify non-contiguous protein segments which may be combined into a single TLS group. |
| Translation Analysis of Tr |
|---|
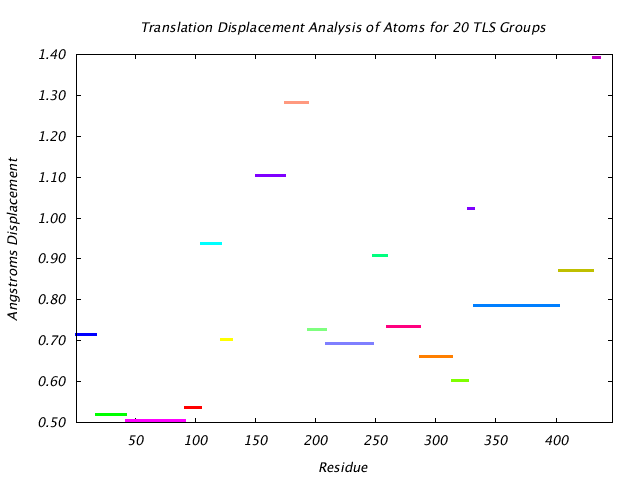 |
This graph shows the TLS group translational displacement magnitude of the three principal components of the reduced T tensor at a isoprobability magnitude of 85%. The line colors are the same as those used for the TLS groups in the various structure visualizations. |
| Screw Displacement Analysis |
|---|
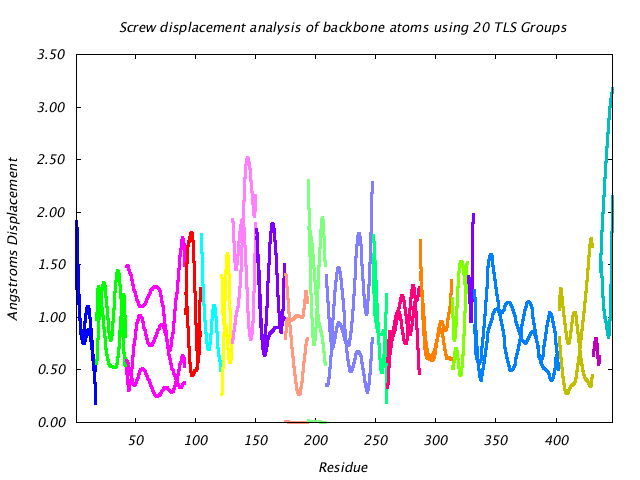 |
This graph shows the displacement of main chain atoms implied by the three screw axes of the TLS group to which they belong. The screw displacement axes are calculated in terms of a Gaussian variance-covariance tensor, and displacement magnitude is shown at a 85% isoprobability magnitude like the translational displacement. Protein segments undergoing hinge-like motion show up as peaks in this graph. |
| Deviation of Observed CA Atom B-Factors From TLS Model |
|---|
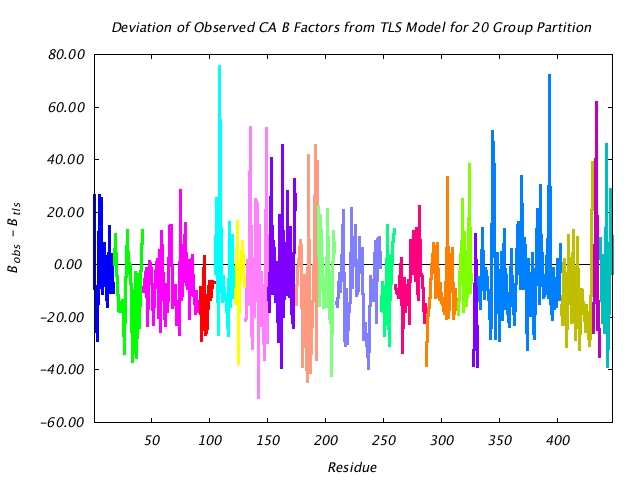 |
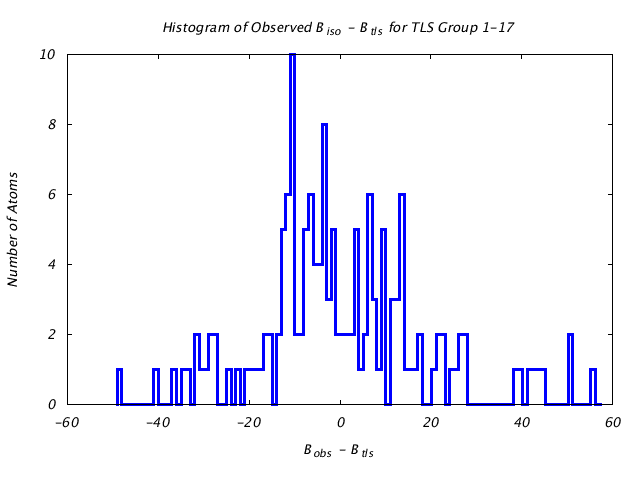
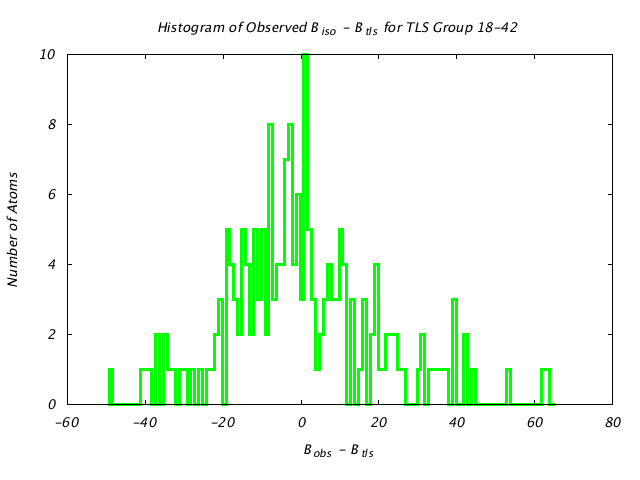
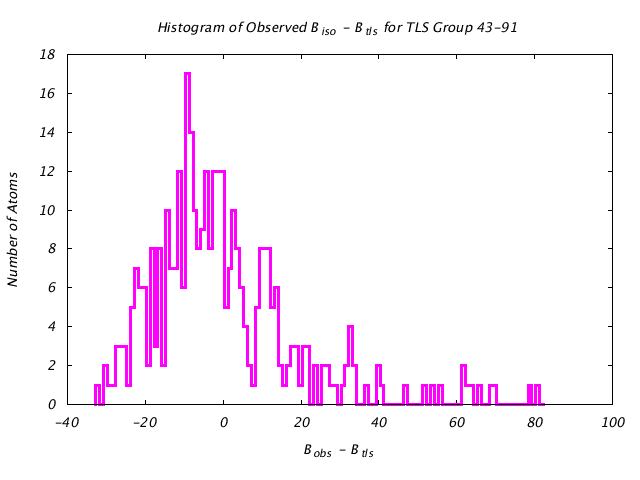
This graph assesses the quality of the TLS prediction for each residue by graphing the difference between the refined (input) main chain atom B factors and the corresponding B factors implied by the TLS model alone. If the TLS model were a perfect description of the observed thermal motion described by the input structural model, this plot would consist of a line at 0. |
| RMSD Deviation of Observed vs. TLS Predicted B Factors |
|---|
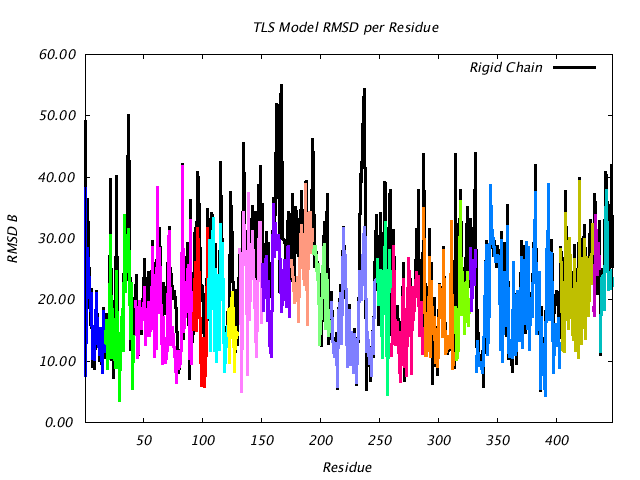 |
This plot is similar to the plot above, except that instead of plotting (Bpred - Bobs) for the CA atom only, the colored line plots the RMSD of |Bpred-Bobs| for all atoms in the residue. If the TLSMD model were a perfect description of the input B values, then the colored line would be a horizontal line at 0. |
| Distribution Histogram of TLS Group 1-17 |
|---|
 |
| Distribution Histogram of TLS Group 18-42 |
|---|
 |
| Distribution Histogram of TLS Group 43-91 |
|---|
 |
| Distribution Histogram of TLS Group 92-104 |
|---|
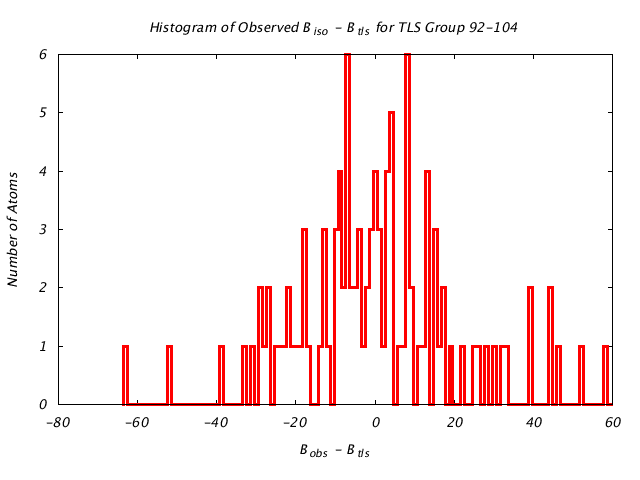 |
| Distribution Histogram of TLS Group 105-121 |
|---|
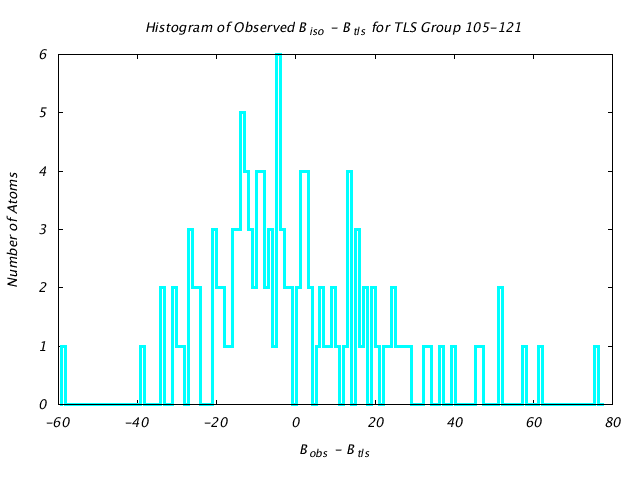 |
| Distribution Histogram of TLS Group 122-130 |
|---|
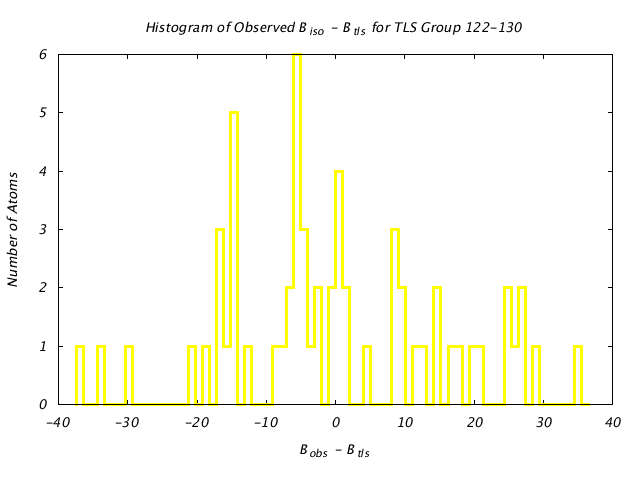 |
| Distribution Histogram of TLS Group 131-150 |
|---|
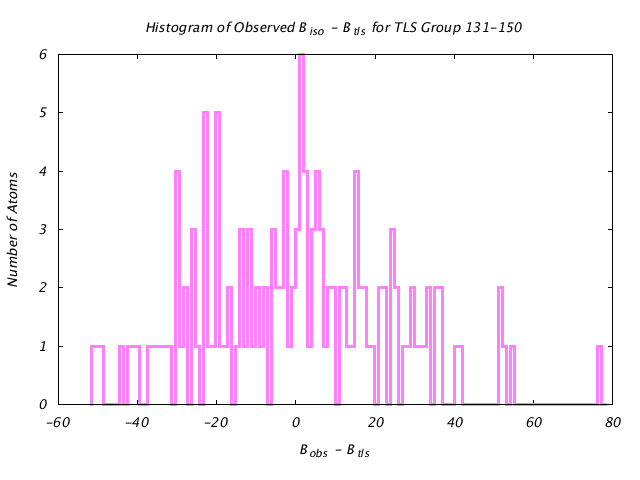 |
| Distribution Histogram of TLS Group 151-174 |
|---|
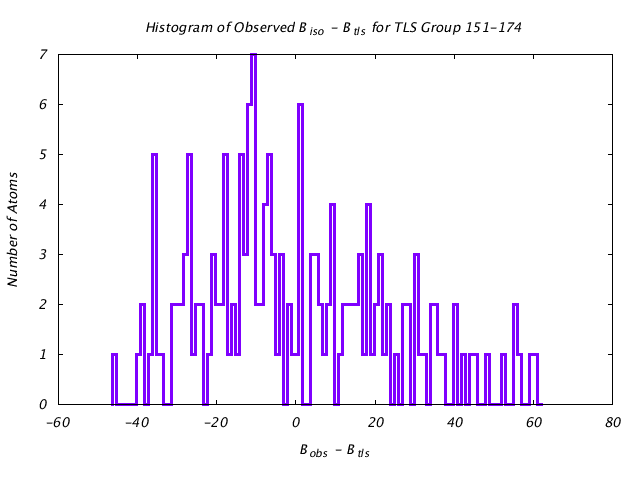 |
| Distribution Histogram of TLS Group 175-193 |
|---|
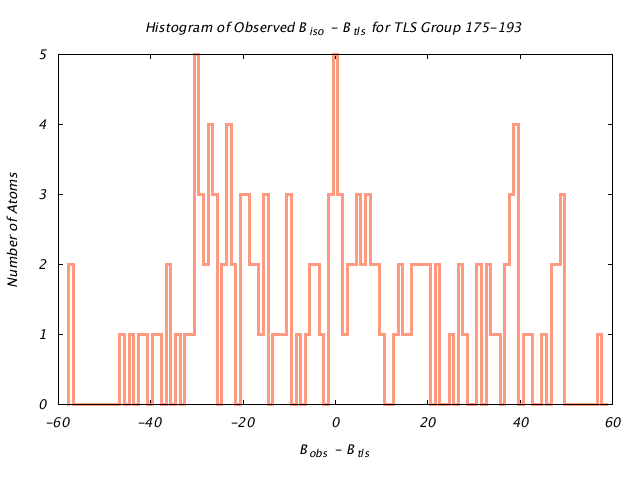 |
| Distribution Histogram of TLS Group 194-208 |
|---|
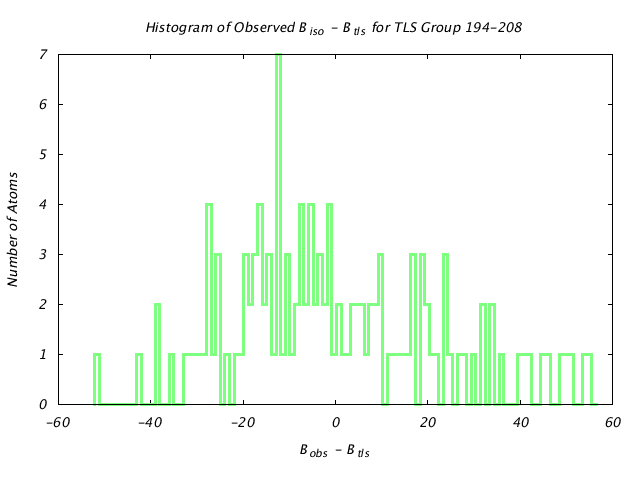 |
| Distribution Histogram of TLS Group 209-247 |
|---|
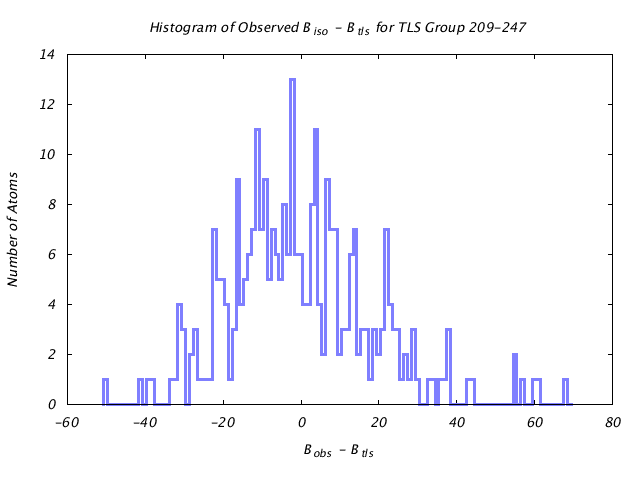 |
| Distribution Histogram of TLS Group 248-259 |
|---|
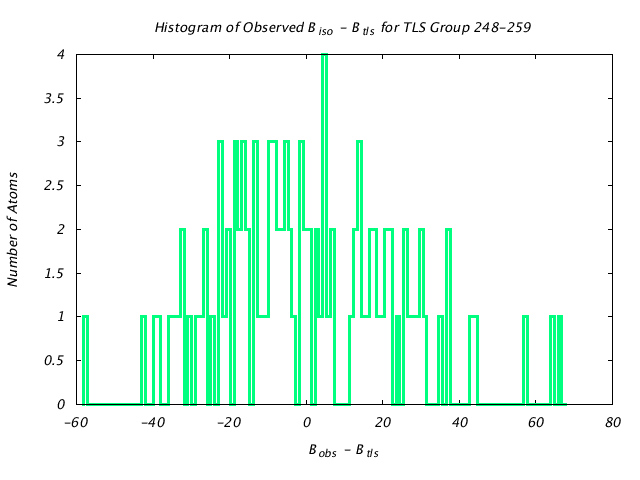 |
| Distribution Histogram of TLS Group 260-286 |
|---|
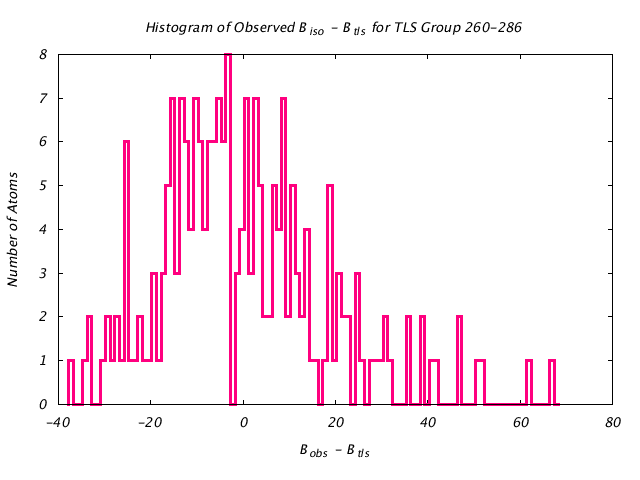 |
| Distribution Histogram of TLS Group 287-313 |
|---|
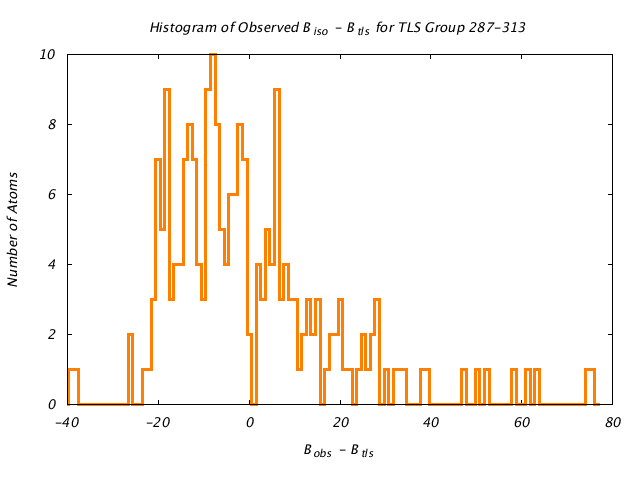 |
| Distribution Histogram of TLS Group 314-326 |
|---|
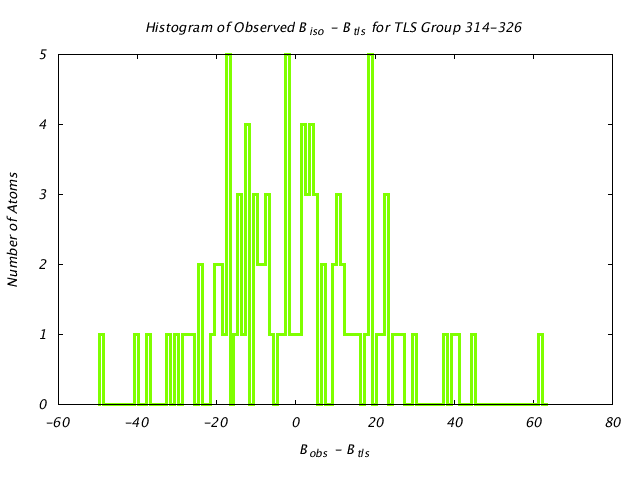 |
| Distribution Histogram of TLS Group 327-331 |
|---|
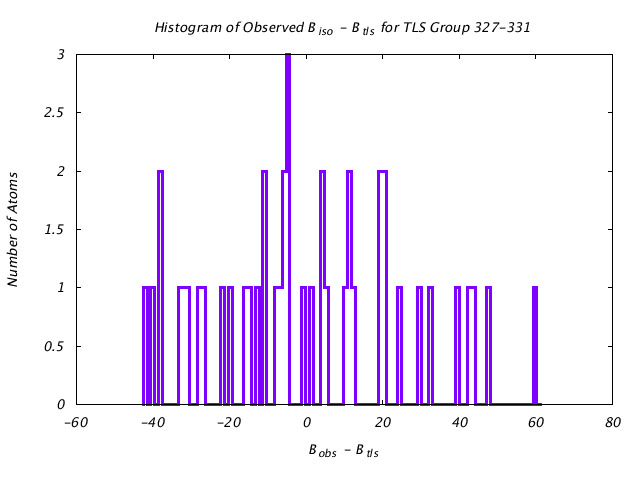 |
| Distribution Histogram of TLS Group 332-402 |
|---|
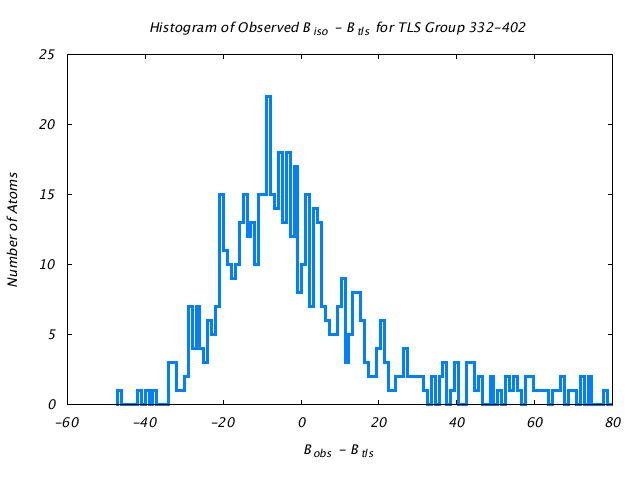 |
| Distribution Histogram of TLS Group 403-430 |
|---|
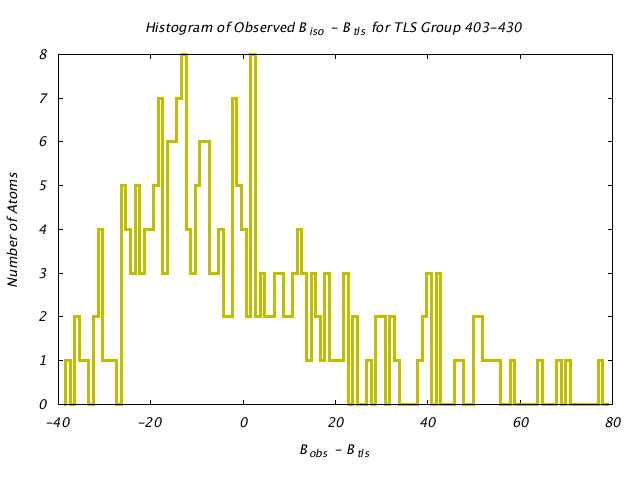 |
| Distribution Histogram of TLS Group 431-436 |
|---|
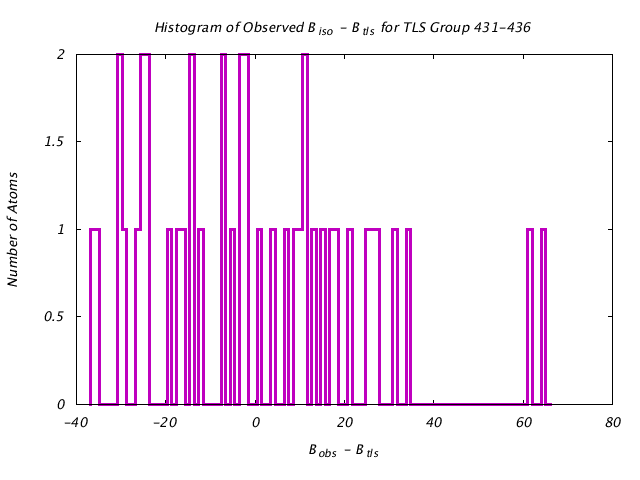 |
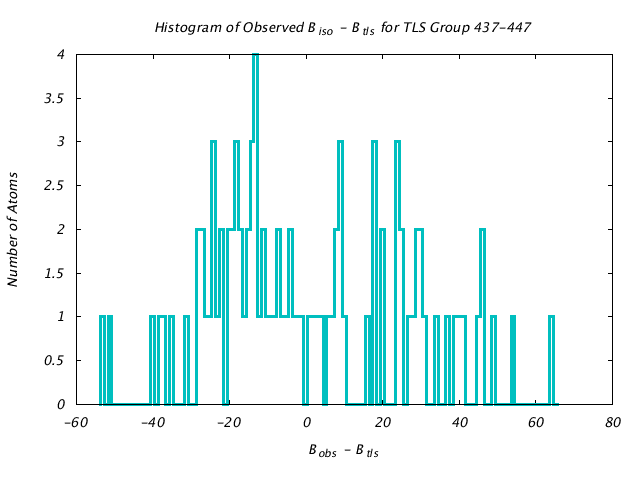
| Distribution Histogram of TLS Group 437-447 |
|---|
 |
| 30 Mar 2010 | JobID: TLSMD7780_IMKsrOzP | TLSMD Version 1.4.1 Released 11 February 2010 |