#
# Various ways of displaying distribution of y values in a data file
#
# Generate a reusable set of N random data points.
nsamp = 3000
set print $viol1
do for [i=1:nsamp] {
y = (i%4 == 0) ? 300. + 70.*invnorm(rand(0)) \
: (i%4 == 1) ? 400. + 10.*invnorm(rand(0)) \
: 120. + 40.*invnorm(rand(0))
print sprintf(" 35.0 %8.5g", y)
}
unset print
set print $viol2
do for [i=1:nsamp] {
y = (i%4 == 0) ? 300. + 70.*invnorm(rand(0)) \
: (i%4 == 1) ? 250. + 10.*invnorm(rand(0)) \
: 70. + 20.*invnorm(rand(0))
print sprintf(" 34.0 %8.5g", y)
}
unset print
#
set border 2
set xrange [33:36]
set xtics ("A" 34, "B" 35)
set xtics nomirror scale 0
set ytics nomirror rangelimited
unset key
set jitter overlap first 2
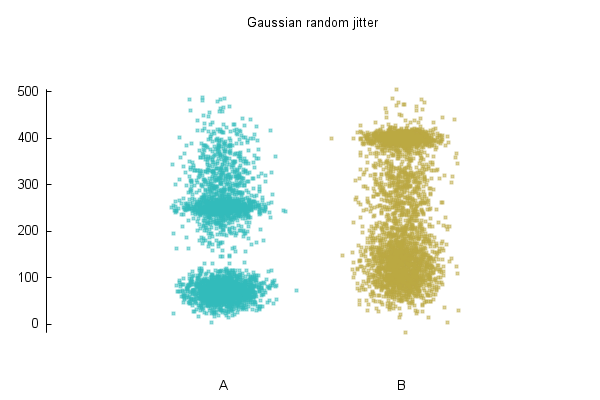
set title "swarm jitter with a large number of small points approximates a violin plot"
set style data points
set linetype 9 lc "#80bbaa44" ps 0.5 pt 5
set linetype 10 lc "#8033bbbb" ps 0.5 pt 5
plot $viol1 lt 9, $viol2 lt 10
Click here for minimal script to generate this plot