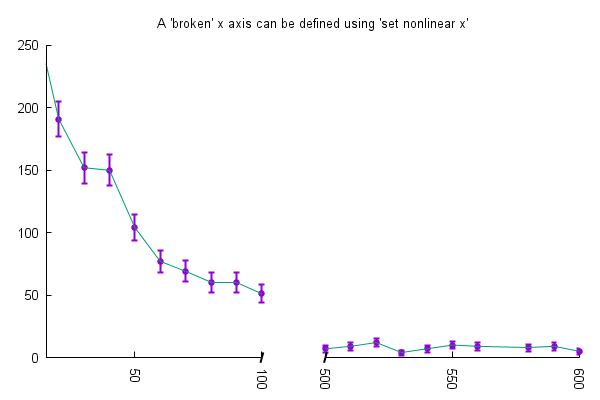
# This example shows how a nonlinear axis definition can be used to # create a "broken axis". X coordinates 0-100 are at the left, # X coordinates 500-1000 are at the right, there is a small gap between them. # So long as no data points with (100 < x < 500) are plotted, this works as expected. # # f(x) maps x axis (discontinuous) to shadow axis coords (continuous linear range [0:1000]) # g(x) maps shadow axis coords to x axis readout # set title "A 'broken' x axis can be defined using 'set nonlinear x'" # Define the broken-axis mapping axis_gap = 25. f(x) = (x <= 100) ? x : (x < 500) ? NaN : (x - 400 + axis_gap) g(x) = (x <= 100) ? x : (x < 100 + axis_gap) ? NaN : (x + 400 - axis_gap) set xrange [15:600] noextend set nonlinear x via f(x) inverse g(x) set xtics 50. set xtics rotate by -90 nomirror set ytics nomirror set border 3 unset key # Creation of the broken axis marks (this should be automated) set arrow 500 from 100, graph 0 to 500, graph 0 nohead lw 2 lc bgnd front set arrow 501 from 100, graph 0 length graph .01 angle 75 nohead lw 2 front set arrow 502 from 100, graph 0 length graph -.01 angle 75 nohead lw 2 front set arrow 503 from 500, graph 0 length graph .01 angle 75 nohead lw 2 front set arrow 504 from 500, graph 0 length graph -.01 angle 75 nohead lw 2 front plot 'silver.dat' with yerrorbars lw 2, '' with lines #Click here for minimal script to generate this plot
