 MSMS + Raster3D
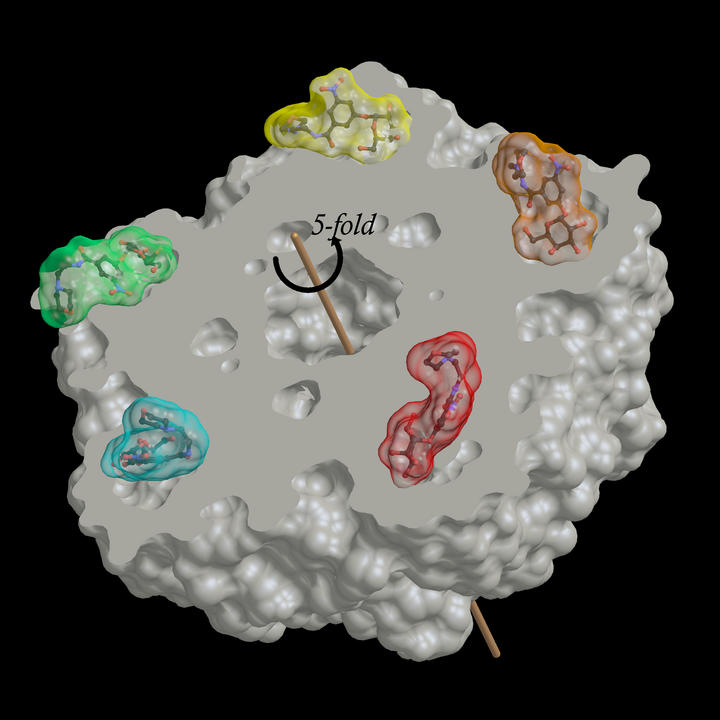
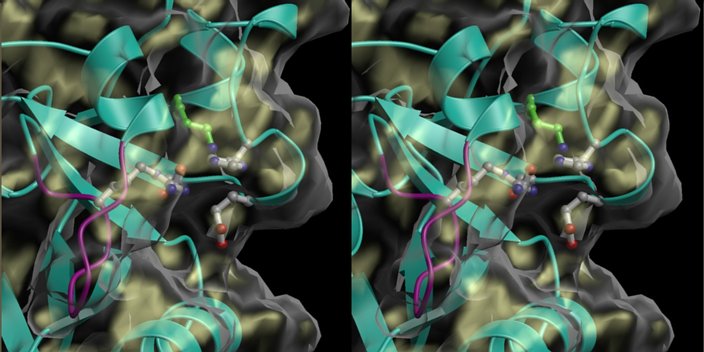
This figure illustrates using Raster3D to draw a slice through a molecular surface, revealing interior cavities and channels.
Full size image:
PNG format (280 kByte)
JPEG format (49 kByte)
|
MSMS + Raster3D This figure illustrates using Raster3D to draw a slice through a molecular surface, revealing interior cavities and channels.
Full size image: |
 XtalView + Raster3D
You can render the canvas window of an XtalView map-fitting session as a Raster3D image via a simple pull-down menu.
Full size image: |
 XtalView + Raster3D
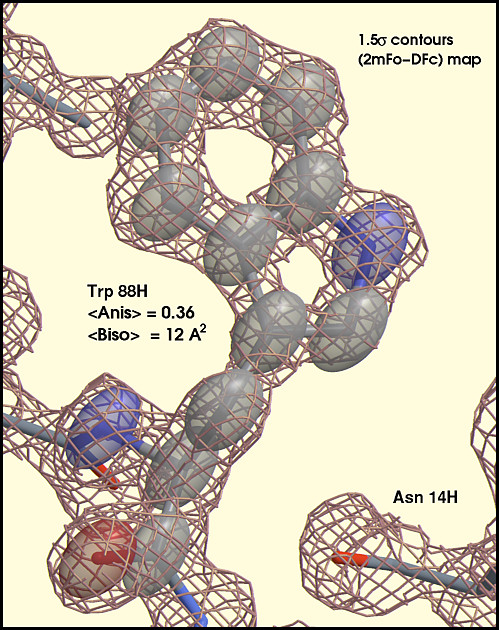
Both XtalView and Raster3D can now represent thermal ellipsoids. This view of ellipsoids + density from the 1.25Å refinement of CTB was composed by merging files from Xfit and rastep, and then labeled using ImageMagick.
Full size image: |
 ORTEX + Raster3D
Patrick McArdle has adapted the Raster3D components rastep and render for use with the small-molecule visualization tool ORTEX.
Full size image: |
 New in version 2.3 "glow" lighting
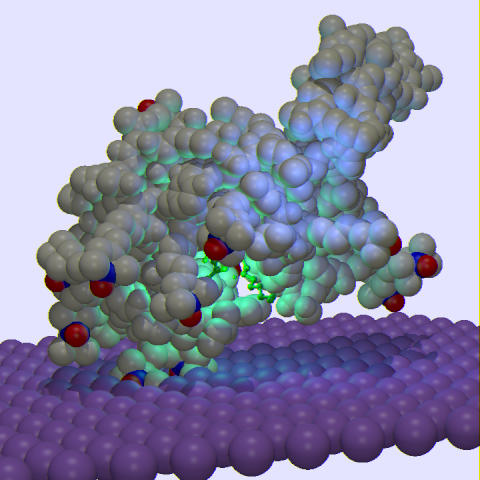
Position of Bee Venom Phospholipase A2 at the Membrane Surface Using a Novel Electron Paramagnetic Resonance Technique (image courtesy of Ellie Adman).
Full size image: |
 Example6:
The Raster3D utility programs ribbon and rings3d
can generate filled-ring diagrams of sugars, nucleic acids, and other
biological molecules.
Example6:
The Raster3D utility programs ribbon and rings3d
can generate filled-ring diagrams of sugars, nucleic acids, and other
biological molecules.
Full size image: |
 Example2:
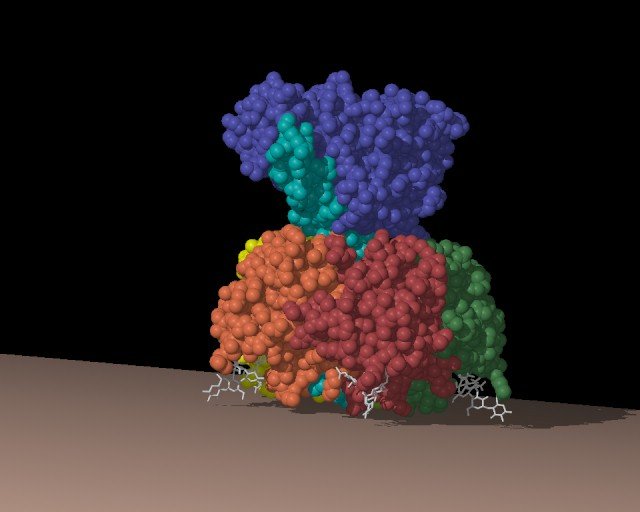
A representation of the E. coli heat-label enterotoxin LT-I
binding to multiple copies of a branched oligosaccharide at the cell
surface. This example was created using the Raster3D utility programs
balls and rods.
Example2:
A representation of the E. coli heat-label enterotoxin LT-I
binding to multiple copies of a branched oligosaccharide at the cell
surface. This example was created using the Raster3D utility programs
balls and rods.
Full size image: |
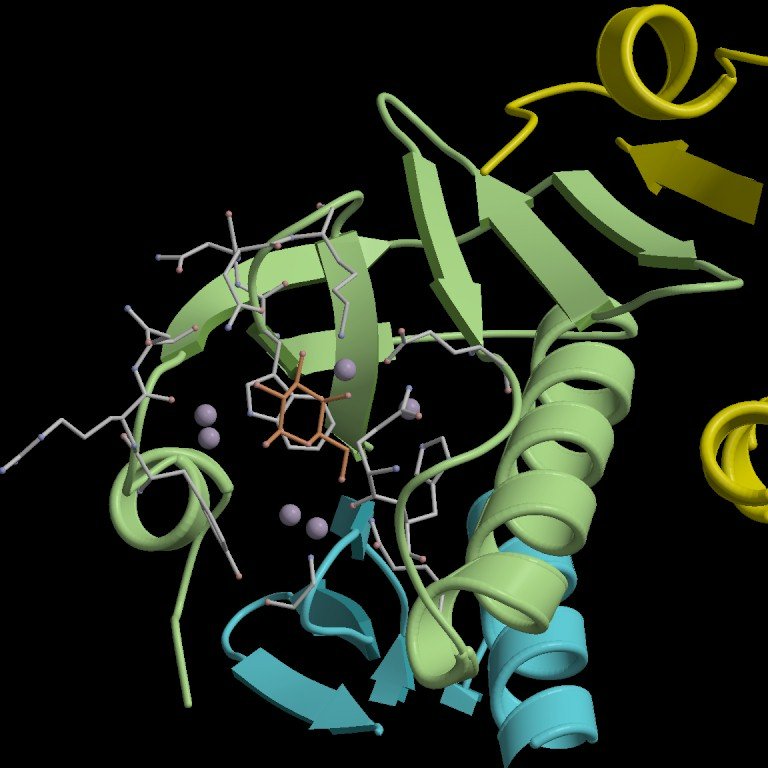
 Example3:
A closer view of the sugar binding site in the LT-I toxin.
This figure was created by feeding the output of Per Kraulis' program
Molscript into the Raster3D rendering program.
Example3:
A closer view of the sugar binding site in the LT-I toxin.
This figure was created by feeding the output of Per Kraulis' program
Molscript into the Raster3D rendering program.
Full size image: |
 Example4:
Another closeup of the same binding site in the closely related
Cholera toxin. This example was created using the Raster3D utility
programs balls and rods.
Example4:
Another closeup of the same binding site in the closely related
Cholera toxin. This example was created using the Raster3D utility
programs balls and rods.
Full size image: |
|
Full size image: |
 An MPEG movie:
Clemens Vonrhein and Gerd Schlauderer (University of Freiburg)
have used Molscript and Raster3D to prepare an animation of adenylate
kinase moving between the "open" and "closed" conformations.
More information on
"Adenylate Kinase - the movie"
is available from the authors via WWW.
This work was described in Structure 3: 483-490 (1995).
An MPEG movie:
Clemens Vonrhein and Gerd Schlauderer (University of Freiburg)
have used Molscript and Raster3D to prepare an animation of adenylate
kinase moving between the "open" and "closed" conformations.
More information on
"Adenylate Kinase - the movie"
is available from the authors via WWW.
This work was described in Structure 3: 483-490 (1995).
An
MPEG version of the movie is available here.
|