The original Parvati analysis
was based on all 28(!) protein structures
in the PDB with anisotropic descriptions of the atoms.
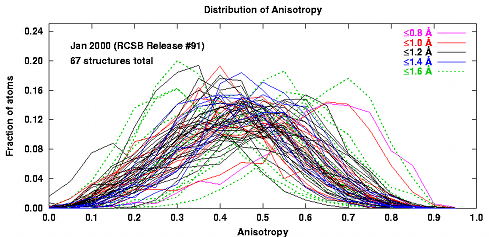
By 2000 the number had grown to 67 (upper figure).
When we re-surveyed the PDB for
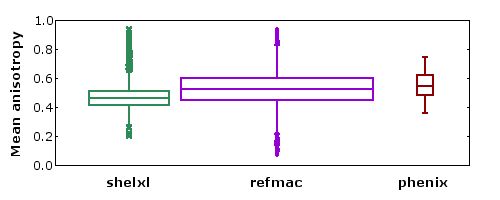
anisotropic models in 2010,
there were more than a thousand models refined with a full set
of 6 parameters for each atom, and more
than 5000 models in which anisotropy was modeled using TLS.
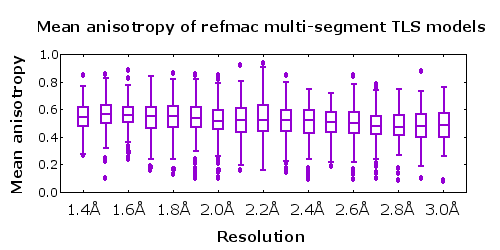
In my experience, full anisotropic refinement at resolutions worse than 1.40Å is improved by adjusting the restraint weights to force the resulting distribution of anisotropy nearer to that seen for the higher resolution structures. This can be confirmed by following the Rfree residual. However, at these resolutions it is a good idea to try a multi-group TLS model as an alternative. The TLSMD server can help you select a multi-group TLS model. |
|